Global market course
Learn the Global Markets.
A beginner-friendly introduction to markets, stocks, sectors and risk — and how ATLAS brings these ideas together to help you build a portfolio.
Welcome to Global Markets
Understand what global financial markets are and why they matter.
Global markets are the worldwide network where financial assets such as stocks and other securities are bought and sold. They allow companies to raise capital and give investors the opportunity to participate in the growth and performance of businesses around the world.
Real-world example
A company such as Apple can raise money from investors by issuing shares. Investors can then buy and sell those shares based on their expectations about Apple's future performance.
What Are Stocks?
Learn what owning a stock actually means.
A stock represents a unit of ownership in a publicly traded company. When you buy a stock, you become a shareholder and gain exposure to the company's future performance. A stock's market price reflects what buyers and sellers believe the company may be worth in the future.
Company performance
Results, growth and expectations can influence investor demand.
Economic conditions
Interest rates, inflation and the broader economy can affect companies and their valuations.
Market events
Industry changes, geopolitical events and other developments can move prices.
Real-world example
If investors expect demand for electric vehicles to increase, they may become more optimistic about companies involved in the electric-vehicle industry. This can influence demand for their stocks and therefore their prices.
What Is ATLAS?
From historical data to quantitative investment insights.
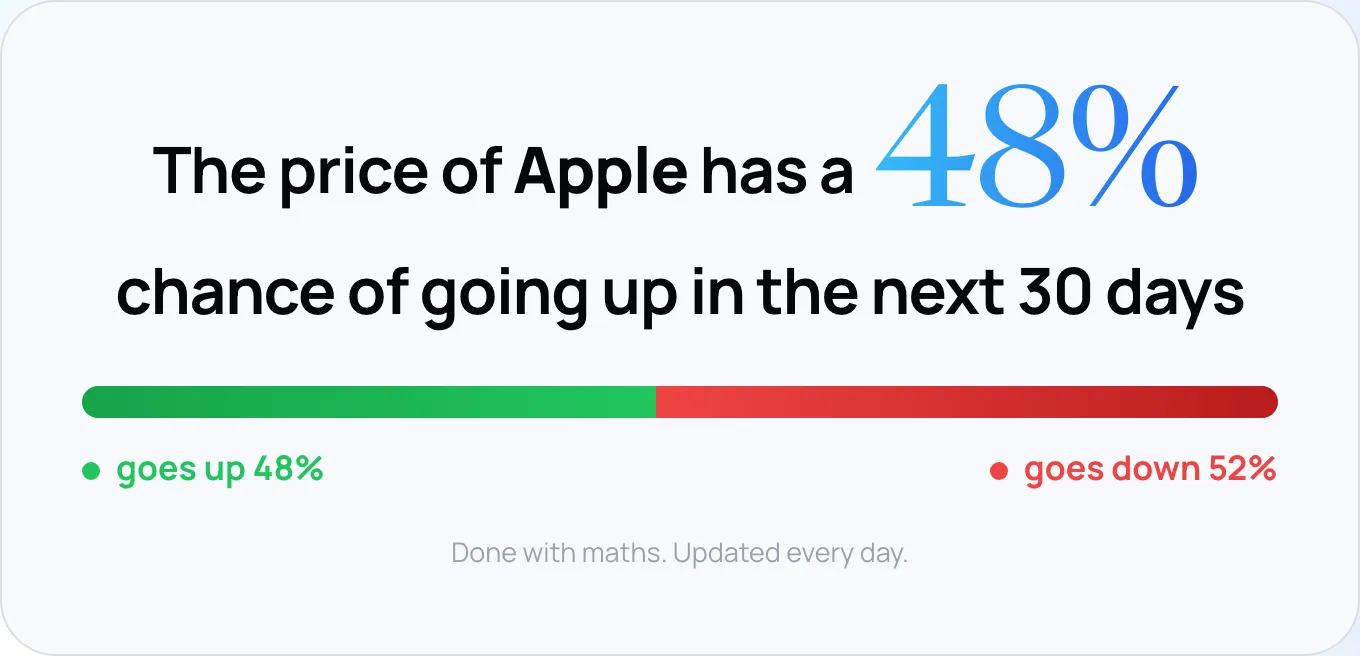
ATLAS is a quantitative investment platform that uses historical market data to compute probabilities about future stock-price movements. These quantitative insights help users understand potential outcomes and construct portfolios according to the return and risk characteristics they choose.
Instead of relying only on intuition, ATLAS analyzes data from the past to identify patterns and calculate probabilities that can support investment decisions.
How Are Portfolios Built?
Your portfolio starts with the return you want and the risk you are willing to take.
Choose your risk profile
Lower risk
Prioritizes a lower level of risk and more limited price fluctuations.
Middle ground
Seeks a balance between potential return and risk.
Higher risk
Accepts higher risk in pursuit of higher potential return.
Or define your own parameters
Volatility
How much a stock's price moves over time. Higher volatility generally means larger price movements and greater uncertainty.
Beta
How sensitive a stock is to movements in the broader market. A beta above 1 generally indicates greater sensitivity than the market; below 1 generally indicates lower sensitivity.
Interactive — Risk Profile Selector
Understanding Market Sectors
Companies can be grouped according to the business areas in which they operate.
Sectors are specific areas of the global markets that group companies according to the type of business they conduct. For example, the pharmaceutical and healthcare sector includes companies involved in medicines, healthcare products and related services.
Examples of sectors
Real-world example
If oil prices rise sharply, investors may consider how the Energy sector could benefit while also considering which other sectors could be negatively affected by higher energy costs.
Build a Portfolio
Bring together return, risk, beta, volatility and sectors to create a portfolio that reflects your objectives.
A portfolio is a combination of stocks. Start by defining the characteristics you are looking for, then think about how different companies and sectors can work together. ATLAS calculates predictions and probabilities about potential future stock-price movements using quantitative tools such as Monte Carlo simulations.
Portfolio challenge
“You want higher potential returns and are willing to accept larger market movements. How would you adjust your target return, volatility and beta, and what sectors might you consider?”
Understanding Predictions & Probabilities
How ATLAS uses data and simulations to estimate possible future outcomes.
What is a prediction?
A prediction is an estimate of what could happen in the future based on information and patterns observed in historical data. In financial markets, a prediction is not a guarantee — it is an estimate of a possible future outcome.
What is a probability?
A probability expresses how likely a particular outcome is based on the information and assumptions used in the analysis. ATLAS uses probabilities to help users understand the range of potential future stock-price movements.
What is it?
A Monte Carlo simulation is a mathematical method that generates many possible future scenarios by repeatedly changing inputs according to defined assumptions and historical patterns.
What does it do?
Instead of looking at only one possible future, the simulation explores many different paths. The results can then be used to estimate the probability of different outcomes and help illustrate the range of possible future stock prices.
Simple example
Imagine that ATLAS runs thousands of possible scenarios for a stock. Each scenario represents a different potential path the stock price could take. By looking at the results together, ATLAS can estimate the probability of different price outcomes rather than assuming that there is only one future.
How to Build a Portfolio in ATLAS
See how the concepts you have learned are applied directly on the ATLAS platform.
Follow the process step by step: define the return you are looking for, choose the level of risk you are willing to take, and use ATLAS to construct a portfolio based on those objectives.
See it on the platform
Putting It All Together
Connect the concepts to the ATLAS experience.
You've learned what global markets are, what stocks represent, how sectors group companies, and how volatility and beta describe different aspects of risk.
ATLAS brings these concepts together to help construct portfolios based on the return and risk characteristics you choose.
Final Mini Quiz
Check what you've learned.
11 — Final challenge
Become the investor.
Create a portfolio for a fictional investor with a specific return objective and risk tolerance. Select the appropriate risk profile, choose stocks across sectors, and explain your choices.
Build your portfolio →